Single-team forecasting
When will it be done?
The question behind every roadmap update. A Burnup answers it with one date, calculated from an average. Monte Carlo answers it with a range of dates, each with a stated likelihood, which is closer to how delivery actually behaves.
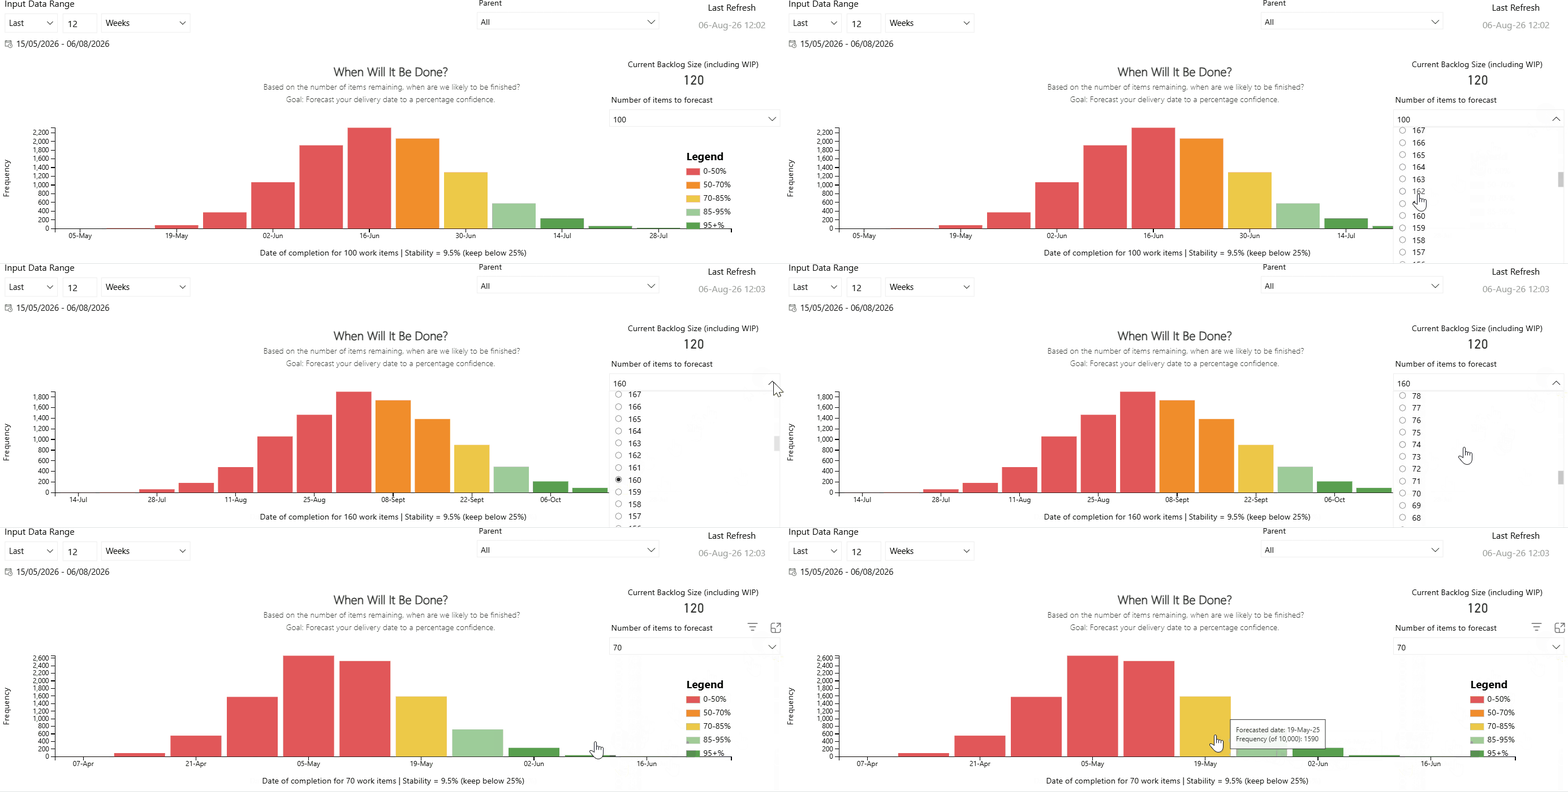
Single-team Monte Carlo forecasting
Monte Carlo forecasting runs your team's actual historical throughput through thousands of simulated futures, replacing one deterministic date with a distribution of likely completion dates, each attached to a confidence level.
A single team, working through a single backlog
The starting point: one team, one backlog, and a "when will it be done?" answer that needs to hold up better than a Burnup's projected intersection point.
Once more than one team or Feature is involved
If a single team is juggling multiple Features or Epics at once, use Epic/Feature Monte Carlo instead. If the work spans multiple teams, use Multi-team Monte Carlo.
Free Tools for Azure DevOps (ADO)
Web-based for Mac & Windows
(Power BI App)
Install the template app and connect to your data without the need to download.
InstallNot ready to connect your own data? Try the demo with dummy data →
Read the full chapter and the maths behind it
Beyond Burnups walks through the accuracy of this approach, what to do with unpredictable data, and why story points aren't the input you think they are.